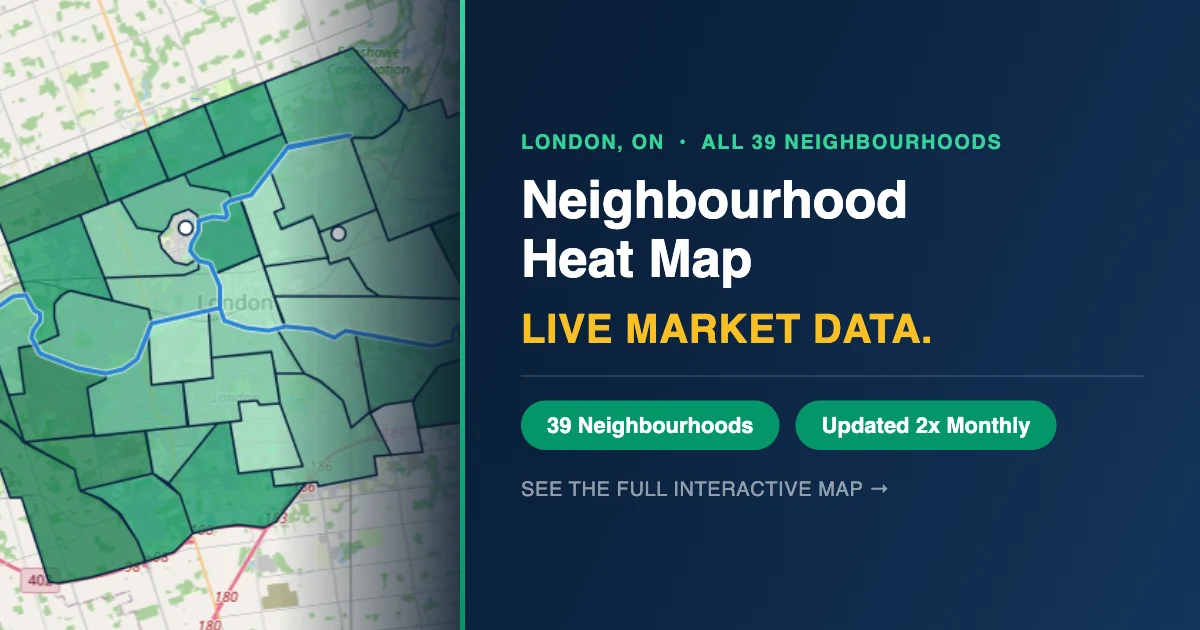
Pull up the live data behind our Neighbourhood Heat Map and you'll find Bradley, a small pocket of London, showing a median home price of $9.5 million. That number is completely real. It's also almost meaningless on its own — and knowing why is exactly what separates a useful neighbourhood statistic from a misleading one.
Why Does Bradley Show a $9.5 Million Median Home Price?
Because Bradley has exactly one active listing right now, and that one property happens to be a $9.5 million estate. A "median" of one data point is just that one number — it tells you nothing about what a typical home in the area costs, because there's no "typical" to measure yet. It's accurate and unhelpful at the same time.
What's the Rule for Trusting a Neighbourhood Statistic?
Always check the active listing count before you trust the price, the days-on-market figure, or any other stat attached to it. As a rough guide, anything under about 15 active listings should be treated as a snapshot of a few specific properties rather than a real market signal. Once a neighbourhood has 40, 50, or 100+ active listings, the averages start actually describing the market rather than describing one or two homes.
More Examples: Crumlin, Old Victoria, and Sharon Creek
Crumlin shows an average of 2 days on market right now. Read quickly, that sounds like the fastest-selling neighbourhood in the city. Read correctly, it means Crumlin has exactly one active listing, and that listing was posted two days before the snapshot was taken — it says nothing about how fast homes there actually sell. Old Victoria (one listing, $1.175 million) and Sharon Creek (two listings, $2.35 million average) are the same story: real numbers, tiny samples, not yet a market pattern.
How Do You Actually Compare Neighbourhoods the Right Way?
Stick to areas with enough active listings for the average to mean something, and compare like against like. Our fastest and slowest-selling neighbourhoods breakdown does exactly this, filtering out the small-sample outliers so the ranking reflects real market behaviour rather than one unusual listing. The Neighbourhood Heat Map shows the active listing count right alongside every other figure specifically so you can make that same check yourself before trusting any number on it.
Considering a specific neighbourhood and want the real picture, not just a headline stat? Reach out to Justin for a straightforward read on what the numbers in your target area actually mean.
Frequently Asked Questions
Why do some London Ontario neighbourhoods show extremely high or low average home prices?
Usually because the neighbourhood has very few active listings. A median or average calculated from one or two properties reflects those specific homes, not a genuine market trend -- Bradley's $9.5 million median, for example, comes from a single active luxury listing.
What counts as a reliable sample size for neighbourhood real estate statistics?
As a rough guide, treat anything under about 15 active listings as a snapshot of a few specific properties rather than a dependable market signal. Neighbourhoods with 40 or more active listings give averages that actually describe typical market behaviour.
Does a low "days on market" number always mean a neighbourhood sells fast?
Not necessarily. It measures how long current active listings have been posted, not how quickly homes there sell. In a neighbourhood with only one active listing, a low days-on-market figure often just means that listing was posted recently -- it isn't evidence of a fast-selling market.
Where can I check real, current numbers for a specific London Ontario neighbourhood?
The interactive Neighbourhood Heat Map at /market-map/ shows live, twice-monthly-updated data for all of London's neighbourhoods, including the active listing count next to every price and days-on-market figure -- so you can judge for yourself how much weight a given number deserves.

Justin Skrypnyk
Real Estate Broker | Sutton Group Chapman Realty Inc., Brokerage | Oakridge, London Ontario
Justin Skrypnyk is a Real Estate Broker serving Oakridge and West London. He writes regularly about the London Ontario market to help buyers and sellers make well-informed decisions.