Here's a fast, numbers-first look at what happened in London Ontario real estate this past week — citywide, and specifically across the 7 areas we work in every day: Oakridge, Byron, Westmount, Riverbend, Lambeth, Whitehills, and West London.
How Many Homes Sold in London Ontario This Week?
120 resale homes sold citywide between July 20 and July 26, 2026 (pre-construction excluded). Against that, 223 new listings came to market, pushing total active inventory to 1,917. The median list price sits at $612,500, and the median sold price came in at $526,250 — a 97.8% average sale-to-list ratio, meaning most homes are selling close to asking rather than deep discounts. Homes took a median of 53 days to sell.
How Did Oakridge, Byron, and Our Other Served Areas Perform?
Of our 7 areas, Lambeth and Byron posted the strongest median sold prices this week, while Oakridge saw the most sales activity relative to its size.
| Area | Active Listings | Sold This Week | Median Sold Price |
|---|---|---|---|
| Oakridge | 55 | 6 | $641,632 |
| Byron | 56 | 6 | $584,500 |
| Westmount | 52 | 6 | $685,000 |
| Riverbend | 45 | 2 | $1,003,950 |
| Lambeth | 82 | 1 | $1,190,000 |
| Whitehills | 67 | 5 | $555,000 |
| West London | 48 | 1 | $510,000 |
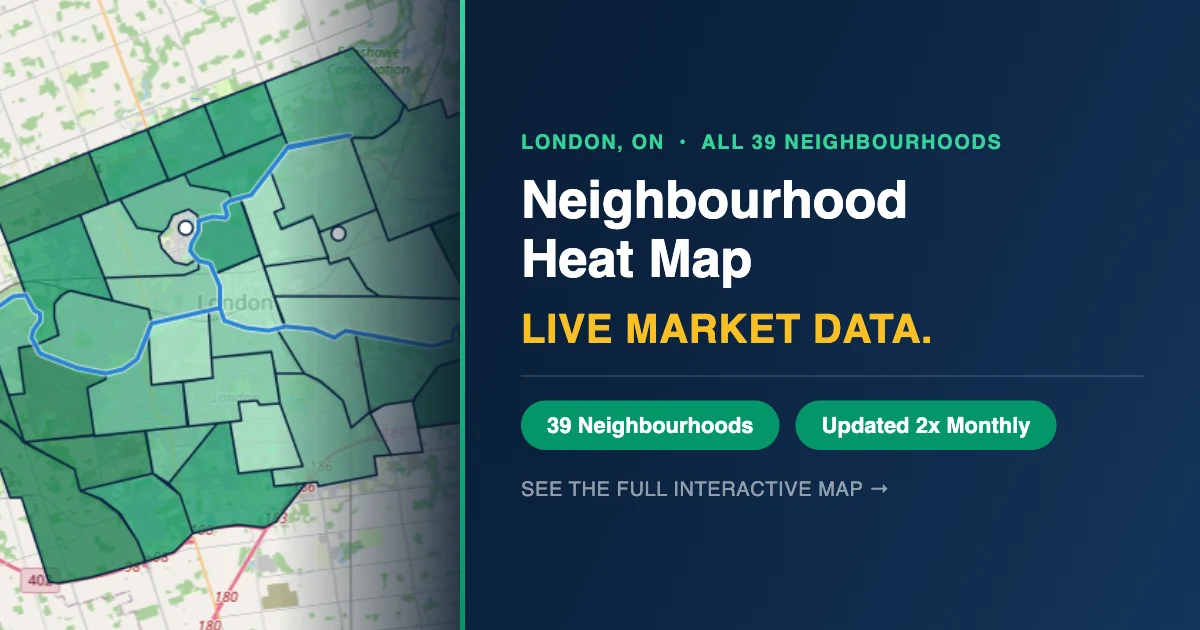
Riverbend and Lambeth's high median sold prices this week reflect a small handful of larger executive homes changing hands rather than a broad price shift — worth keeping in mind with sample sizes this small week to week. Oakridge and Byron both had 6 sales against roughly 55 active listings, a healthier absorption pace than the citywide average. Want the same breakdown across all 39 London neighbourhoods, not just the 7 we serve? The interactive Neighbourhood Heat Map updates with live data.
Which Property Types Sold This Week?
| Property Type | Active Listings | Sold This Week | Median Sold Price |
|---|---|---|---|
| Detached | 1,169 | 73 | $635,000 |
| Semi-Detached | 50 | 5 | $468,000 |
| Townhouse | 328 | 22 | $412,500 |
| Condo/Apartment | 258 | 17 | $359,000 |
Detached homes accounted for over 60% of resale activity this week, which tracks with London's overall inventory mix. Condos and apartments remain the most affordable entry point at a $359,000 median.
What Was the Biggest Sale of the Week?
The top sale citywide this week closed at $1,299,000 for a home on Plane Tree Drive in London North (N6G 5L6). We'll track fastest-selling homes here starting next week once a full cycle of data is in.
What Does This Mean If You're Buying or Selling in Oakridge or West London?
A 97.8% sale-to-list ratio citywide, combined with steady sales in Oakridge and Byron specifically, points to a market that's still rewarding accurately priced homes rather than one that's cooling off broadly. If you're weighing whether to list this week or wait, or want to know exactly where your street sits inside these numbers, a complimentary home evaluation is the fastest way to get a real answer instead of a citywide average. For the bigger monthly picture behind these weekly snapshots, see our June 2026 market update and our look at London's jump in months of supply.
Have a question about how this week's numbers apply to your specific street or property? Reach out to Justin directly.
Frequently Asked Questions
How many homes sold in London Ontario this week (July 20–26, 2026)?
120 resale homes sold citywide (pre-construction excluded), against 223 new listings and 1,917 total active listings. The median sold price was $526,250 with a 97.8% average sale-to-list ratio.
Which of the 7 areas Justin serves had the most sales this week?
Oakridge, Byron, and Westmount each recorded 6 sales this week. Oakridge and Byron had the healthiest sales-to-active-listings ratio of the group, each with roughly 55 active listings against those 6 sales.
What was the median sold price in Oakridge this week?
Oakridge posted a median sold price of $641,632 this week, on 6 sales against 55 active listings.
What property type sold the most in London Ontario this week?
Detached homes led with 73 sales, followed by townhouses (22 sales) and condo/apartments (17 sales). Detached homes make up the largest share of both active inventory and completed sales.
Where can I see this data for all of London, not just the 7 areas Justin serves?
The interactive Neighbourhood Heat Map at /market-map/ breaks down active listings, sales, and median pricing across all 39 London neighbourhoods with live, continuously updated data.

Justin Skrypnyk
Real Estate Broker | Sutton Group Chapman Realty Inc., Brokerage | Oakridge, London Ontario
Justin Skrypnyk is a Real Estate Broker serving Oakridge and West London. He writes regularly about the London Ontario market to help buyers and sellers make well-informed decisions.